Beyond corrplot: Rethinking Correlation Visualization for the Next Decade
Published on October 30, 2026 by Viliam Simko
Correlation matrices are a familiar sight in data analysis. They help us spot relationships between variables, but a large matrix can quickly become difficult to read. The way we arrange and display the values matters: a good plot reveals patterns, while a poor one hides them.
This is what makes the future of corrplot interesting to me. I want to keep the R package useful and dependable for the people who already rely on it, while gradually making its ideas available in other environments too — from notebooks and reports to web applications. That is not a plan to replace R, or to rewrite everything at once. It is a chance to build on a tool with an established user base and make it useful in more places. The broader direction and the work behind the existing package are also described in the corrplot project overview.
A correlation matrix is not just a heatmap
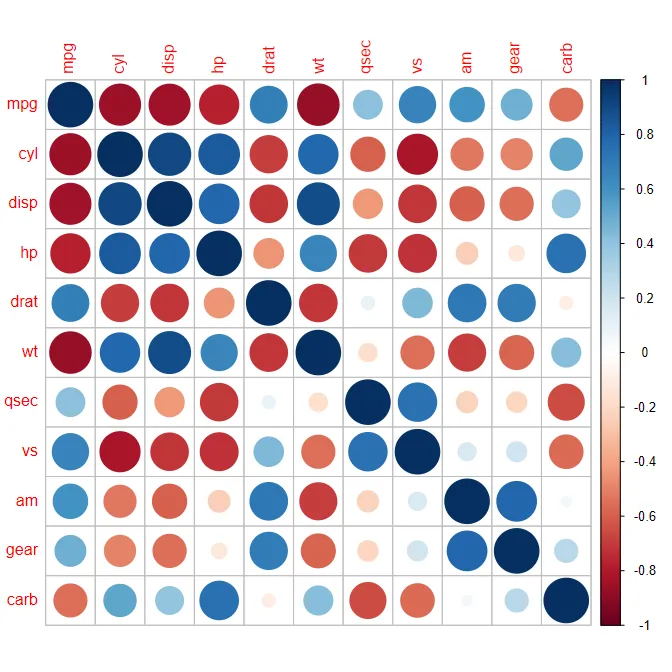
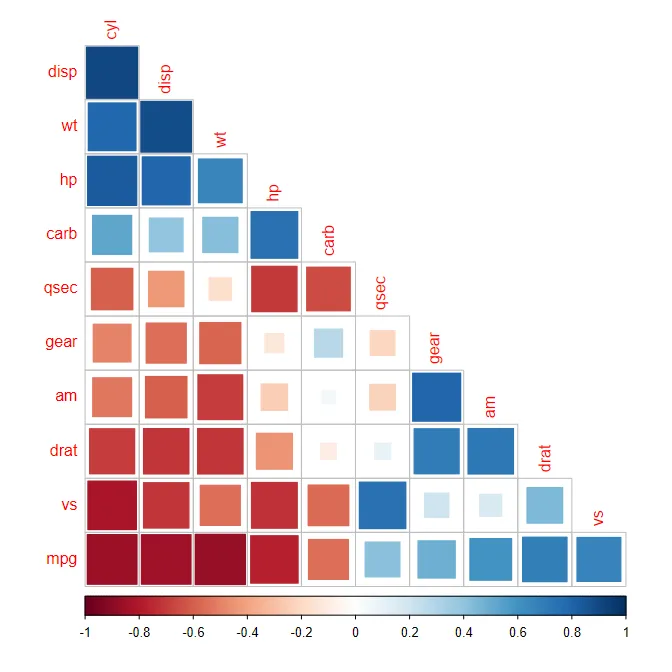
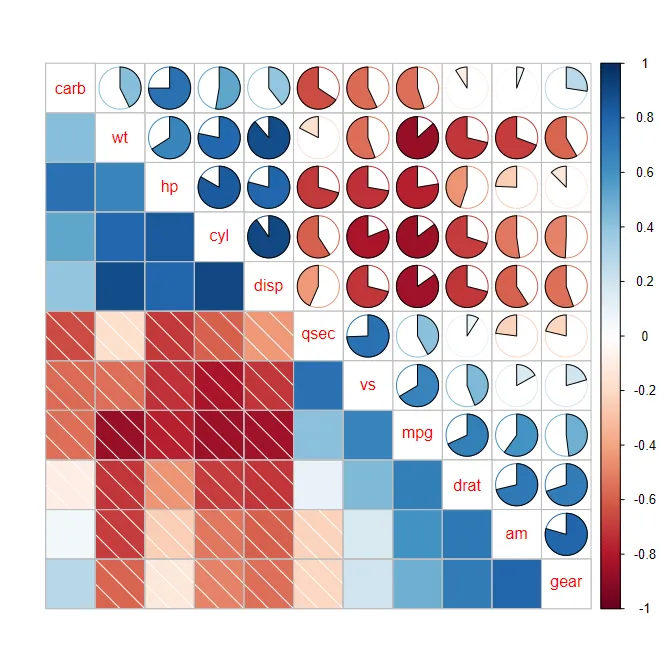
The first choice is how to represent each correlation. Colour is a quick way to show direction and strength, but circles, squares, ellipses, and pie charts can make different patterns easier to notice. Numbers are helpful when the exact value matters, while reordering variables can bring related ones closer together.
The examples below use the built-in mtcars dataset and show a few styles already available in corrplot.
| Circles | Squares (upper triangle) | Pie charts (clustered) | Circles with significance |
|---|---|---|---|
 |
 |
 |
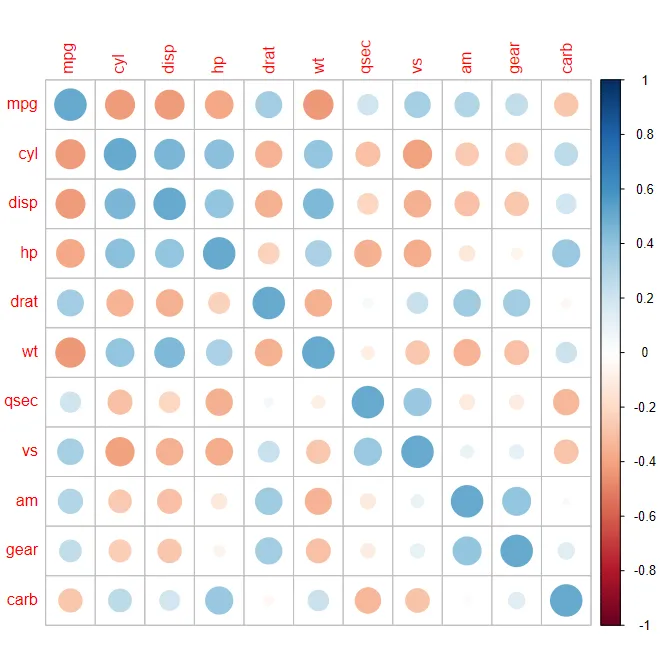 |
There is no single best style. A compact colour plot may be right for an overview; circles can make differences in strength easier to compare; pie charts offer another way to show the values. The choice depends on the data and on what the reader wants to understand.
Whatever the style, the meaning should stay clear. For example, a strong-looking colour should not be mistaken for statistical significance. A good visualization helps people explore the data without suggesting more than the data can tell us.
A tool worth building on
I became involved in the corrplot project in 2016. The package was already useful, but the project needed some of the foundations that make open-source software easier to maintain: a place to report issues, automated tests, and continuous integration.
I took the initiative to put those foundations in place and improve the project workflows. I also helped bring the package to the attention of scientific communities. Over time, corrplot became part of workflows used by researchers in many fields.
Its use in published research is one reason continuity matters. Examples include papers in Nature, Nature Medicine, and Nature Communications. These are selected examples, not an exhaustive list. A Google Scholar search for corrplot-related publications returned approximately 8,690 results on 27 October 2026. This is a search-result count rather than an exact count of unique citations, and the results can change over time. More examples and project background are available in the corrplot project overview.
People have built scripts, reports, and research workflows around the package. They should not have to rewrite them just because the software is being improved. Keeping existing behaviour working is therefore one of the main requirements for its next stage.
That does not mean nothing can change. It means making improvements carefully, checking how they affect existing users, and keeping familiar defaults wherever possible.
One foundation, more ways to use it
If corrplot is to support more than one environment, it helps to distinguish the information in a correlation matrix from the way it is displayed.
The values, labels, and ordering describe what should be shown. The R plotting code, a web interface, or another tool determines how it appears on screen. Keeping those ideas separate could make it easier to offer the same familiar visualization choices in different places.
R will remain an important part of the project. It is a natural environment for statistics and reproducible research, and the existing package will continue to be maintained. The wider goal is to make selected functionality reusable, not to move R users onto a different platform.
There are still practical questions to answer. Which features make sense to share? Which are better left to each environment? How can different versions behave consistently without becoming difficult to install and maintain? I expect the answers to come from small working examples and experience, rather than from choosing a technology first.
Keep improvements dependable
A plot can look convincing and still be wrong. That is why changes need to be checked against real examples, including awkward cases such as missing values, unusual input, or matrices with many variables.
Performance matters too, especially for larger datasets. But speed comparisons are only useful when they measure the same task under similar conditions. The aim is not to win a benchmark at any cost; it is to make the software feel responsive without changing the results people rely on.
These checks are part of maintaining trust. They help us improve the package while making sure that familiar use cases continue to work.
Evolve without leaving users behind
The next stage of corrplot should not begin with a complete rewrite. It should begin by understanding what already works, keeping it reliable, and making room for new possibilities step by step.
My direction is to continue maintaining the R package while exploring how its core ideas could serve other environments. Some parts may be reusable; others may be better kept specific to R or to a particular interface. We do not need to decide everything in advance.
The interesting challenge is to let a trusted tool grow: preserve what its users value, make it easier to maintain, and gradually open it up to new ways of working with correlation data. The ongoing design and prototype work is tracked in the corrplot-ng repository, alongside the original R package.